


The Best Trade This Week Is No Trade at All
And Why I'm Rejecting a 183% Yield

I could constantly serve up new trade ideas like most financial media does—even when the best move is to do nothing. It would keep you engaged and justify my fee, but it's terrible investing advice.
Instead, today I want to focus on different questions:
"Which risks should I reject?" and "How should I manage what I already own?"
For this week's Covered Calls Report, I want to deep dive into these professional questions.
So, this will be a masterclass in two parts:
The Discipline of Rejection: First, we will learn a critical lesson in discipline by analyzing the flawed "opportunities" the broader market tried to offer. We will perform a post-mortem on two very tempting trades that VADER correctly flagged as "bad bets."
The Doctrine of Management: We will review the theory of active covered call management, and I’ll show step by step how to apply it directly to our open positions with a clear, if-then playbook.
Let's begin.
Part 1: A Masterclass in Saying 'No'
A successful strategy is defined more by the bad trades it avoids than the good trades it finds.
This week was a powerful reminder of that truth.
VADER analyzed all the available data for new trades and came back empty — twice.
Yet, this was not a failure; it was a success of the highest order, because it protected the capital.
To show you how, let's dissect two different kinds of "tempting but flawed" trades that the system rejected.
Case Study #1: The In-the-Money (ITM) Yield Trap
This GameStop (GME) contract is a perfect example of a trade that seduces investors with a headline number that hides the underlying risk.

The Contract: GME, July 11, 2025, $20.00 Strike Call
Stock Price: $22.14
Premium (Bid): $2.72 per share
Reported Annualized Yield: 183.85%
The Seduction:
An 183% yield is an intoxicating figure. It represents a massive 12.3% cash return in just 26 days. The immediate question for the beginner is, "How can I not take this trade?"
The Professional's Analysis:
This is an Exit, Not Income: The $20 strike is below the $22.14 stock price, making it an in-the-money (ITM) call. Our goal is to generate repeatable income from stocks we want to own. An ITM call is an exit strategy used to sell a stock. With a delta of 0.726, there is a greater than 70% probability the shares will be sold at expiration.
The Real Return is Pitiful: Your effective sale price for the stock would be the strike plus the premium:
$20.00 + $2.72 = $22.72. The stock was already at $22.14. You are giving up all future upside on a notoriously volatile stock for a guaranteed profit of just 58 cents per share.
This is a terrible risk/reward profile.
Verdict:
Rejected. It's a low-reward exit strategy masquerading as a high-yield income play.
Case Study #2: The High-Wire OTM Gamble
This Tesla (TSLA) trade is more subtle. It’s an out-of-the-money (OTM) call, our preferred setup. But it's still a bad bet.
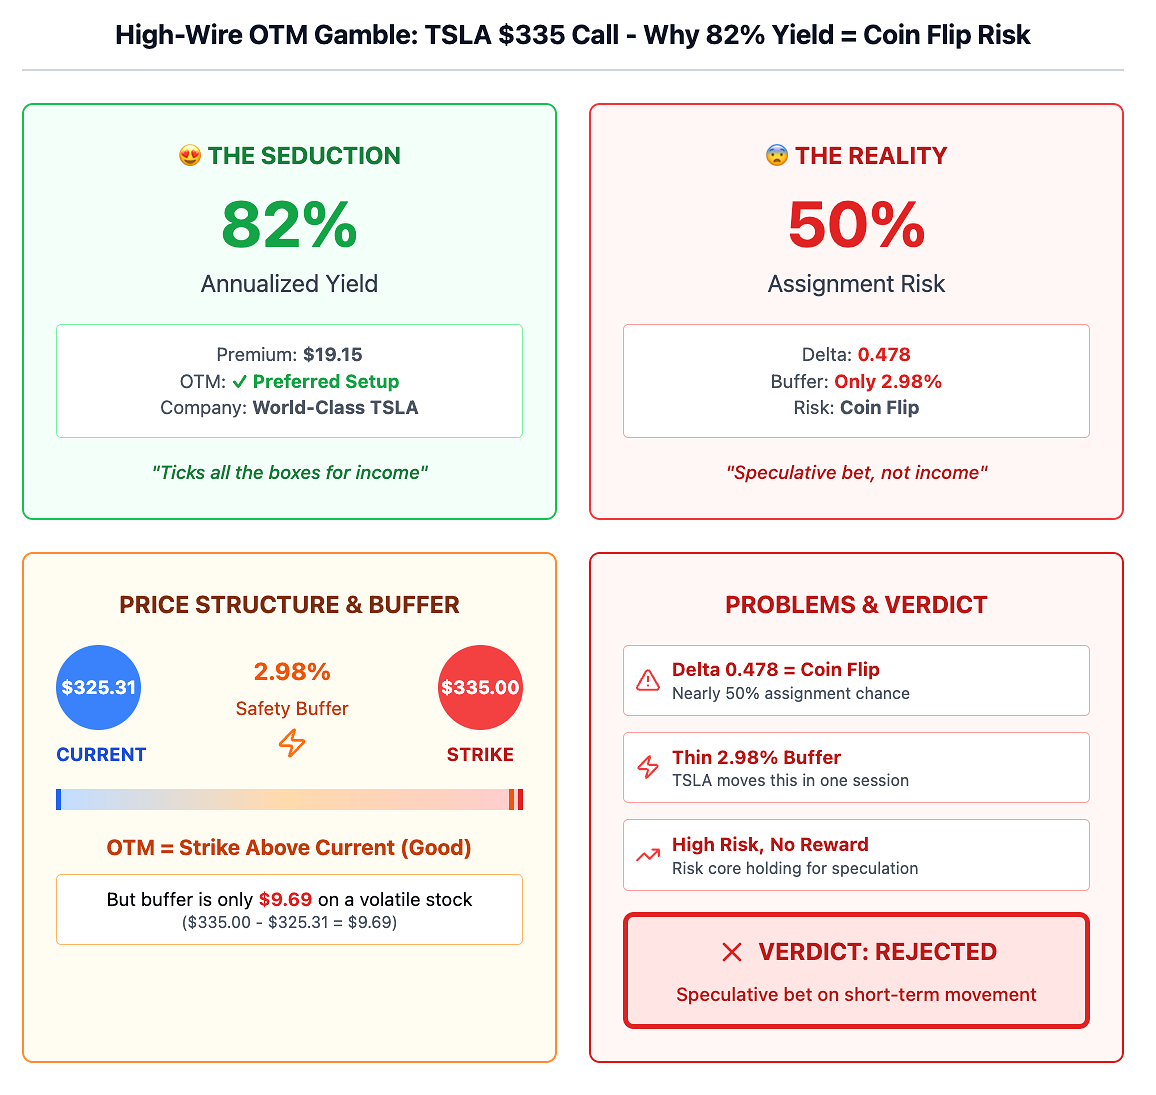
The Contract: TSLA, July 11, 2025, $335.00 Strike Call
Stock Price: $325.31
Premium (Bid): $19.15 per share
OTM Buffer: A mere 2.98%
Calculated Annualized Yield: 82.74%
The Seduction:
An 82% annualized yield on a world-class company is difficult to ignore. It seems to tick all the boxes for an income investor.
The Professional's Analysis:
The Risk of Assignment is Too High: The delta is 0.478. This means you are facing a coin-flip—a nearly 50% chance—of having your expensive Tesla shares called away from you.
The Safety Buffer is Too Thin: In exchange for that 50/50 gamble, you get only a 2.98% cushion before the option goes in-the-money. A stock like Tesla can move that much in a single trading session. To risk losing a core holding, we must be paid a much higher premium or demand a much lower risk of assignment. This trade offers neither.
Verdict:
Rejected. This is a speculative bet on short-term price movement. It is not a disciplined, conservative income trade.

Deconstructing a Winner: Our Successful Apple (AAPL) Trade
Now, let's look at the other side of the coin.
Last week, our covered call on Apple (AAPL) expired. This trade is a perfect example of our strategy working exactly as designed, backed by the real numbers:
The Original Trade: We sold the Apple (AAPL) June 13, 2025, $215 Call Option.
Stock Price at the Time: The snapshot was taken when Apple was at $203.92.
Premium Collected: $4.50 per share, for a total of $450 in cash per contract.
The Outcome: On Friday, June 13th, the option expired worthless because Apple's stock price closed safely below our $215 strike price.
Why This Was a Perfect Trade (The Financial Breakdown):
We Keep 100% of the Premium: The $450 in cash per contract is now pure, realized profit
We Keep All the Shares: Because the stock was not called away, we still own our full position of 100 Apple shares, free and clear.
Our Cost Basis is Lower: That $450 in cash effectively reduces our net cost for owning the Apple shares, increasing our future profit margin and deepening our safety cushion.
The Next Step (The "Rinse and Repeat" Method): What do we do now? We repeat the process. With our Apple shares free from any obligation, we will look for a new opportunity to sell a call for the July expiration cycle. This is the heart of generating steady, repeatable income.
However, you'll notice that even this 'perfect' trade had a reported Annualized Yield of over 160%. This is a critical observation. It shows that both the 'good' trades and the 'bad' ones can flash these huge, potentially misleading numbers
Understanding a Critical Metric: "Annualized Yield"
You have just seen yields of 82% and 183% in our case studies.
Later in this report, you'll see figures over 200% in the active positions management section.
Your instinct to see these numbers as "too good to be true" is correct.
It's the most professional instinct you can have.
Let's clarify what this metric is, and what it is not.
The math behind the number is a simple extrapolation:
(Return from one trade) x (How many times that trade could theoretically be repeated in a year)It is a theoretical metric of efficiency, not a promise of returns.
An Analogy: The Freelancer's Great Week
Imagine a high-end consultant lands a project that pays them $5,000 for one week of intense work. A simple annualization suggests they make $260,000 a year ($5,000 x 52). While mathematically sound, this projection is a fantasy. It doesn't account for weeks with no projects, holidays, administrative tasks, or lower-paying clients.
The high annualized yield on a short-term option is the exact same concept.
A professional uses this number for one purpose only: to compare the relative efficiency of different opportunities.
It allows us to compare a 7-day trade and a 30-day trade on an apples-to-apples basis to see which one is generating cash more rapidly right now.
You must not mistake it for a realistic forecast of your portfolio's annual return.
Now that we understand the discipline we apply to new trades—and the true meaning of the metrics we use—we can approach our own positions with the clear-headedness of a professional manager.
Part 2: A Rules-Based System for Active Management + If-Then Position Management Scenarios
The Theory: The Red, Yellow, Green Management Playbook
The goal is to act deliberately based on a clear system.
I like to triage all positions into three logical categories, each demanding a distinct strategic approach.
🔴 The Red Zone: Strategic Decision Required
A position enters the Red Zone when it is In-the-Money (ITM).
This means the stock price has risen above your strike price. If this holds until expiration, your shares will be called away.
This is not a failure; it is a predictable outcome. Your decision must be based on one key question: "Do I want to keep the shares of this company, or am I happy to sell them at the strike price?"
You have three primary strategies to deploy:
Allow Assignment (The Profit-Taking Exit): This is the default path. You do nothing and let the contract execute. You sell the stock at the strike price and keep 100% of the premium you collected. This is the ideal strategy if you believe the stock is fully valued and you are ready to lock in your profits.
Roll the Position (The Bullish Continuation): If you remain bullish and want to keep your shares, you "roll" the position. You simultaneously Buy to Close your current call and Sell to Open a new call with a later expiration date and a higher strike price. The primary goal is to receive a net credit, meaning you get paid to extend the trade and increase your potential upside. This is your most powerful tool for active management.
Close the Position (The Defensive Reset): In rare cases, you may simply Buy to Close the short call for a small loss. You would do this only if you believe the stock is about to experience a massive rally and you want to capture 100% of that upside, removing the "cap" from your position.
🟡 The Yellow Zone: Proactive Monitoring
These positions are the early warning system.
They are currently OTM but are close enough (typically within a 5% buffer) that a strong rally could put them in danger.
Strategy: The correct approach is "watchful waiting." Your single most important action is to set a price alert at the strike price. If that alert is triggered, the position is immediately reclassified as "Red Zone," and you must decide which of the three strategies above to deploy.
This ensures you are never caught by surprise.
🟢 The Green Zone: The Power of Patience
These positions are far OTM and performing perfectly. The probability of assignment is very low.
Strategy: The best action is no action. Every day that passes, time decay (theta) erodes the value of the option you sold, which is a direct profit for you. Interfering is counterproductive. Let these expire worthless, collect your full premium, and prepare to write new calls for the next cycle.
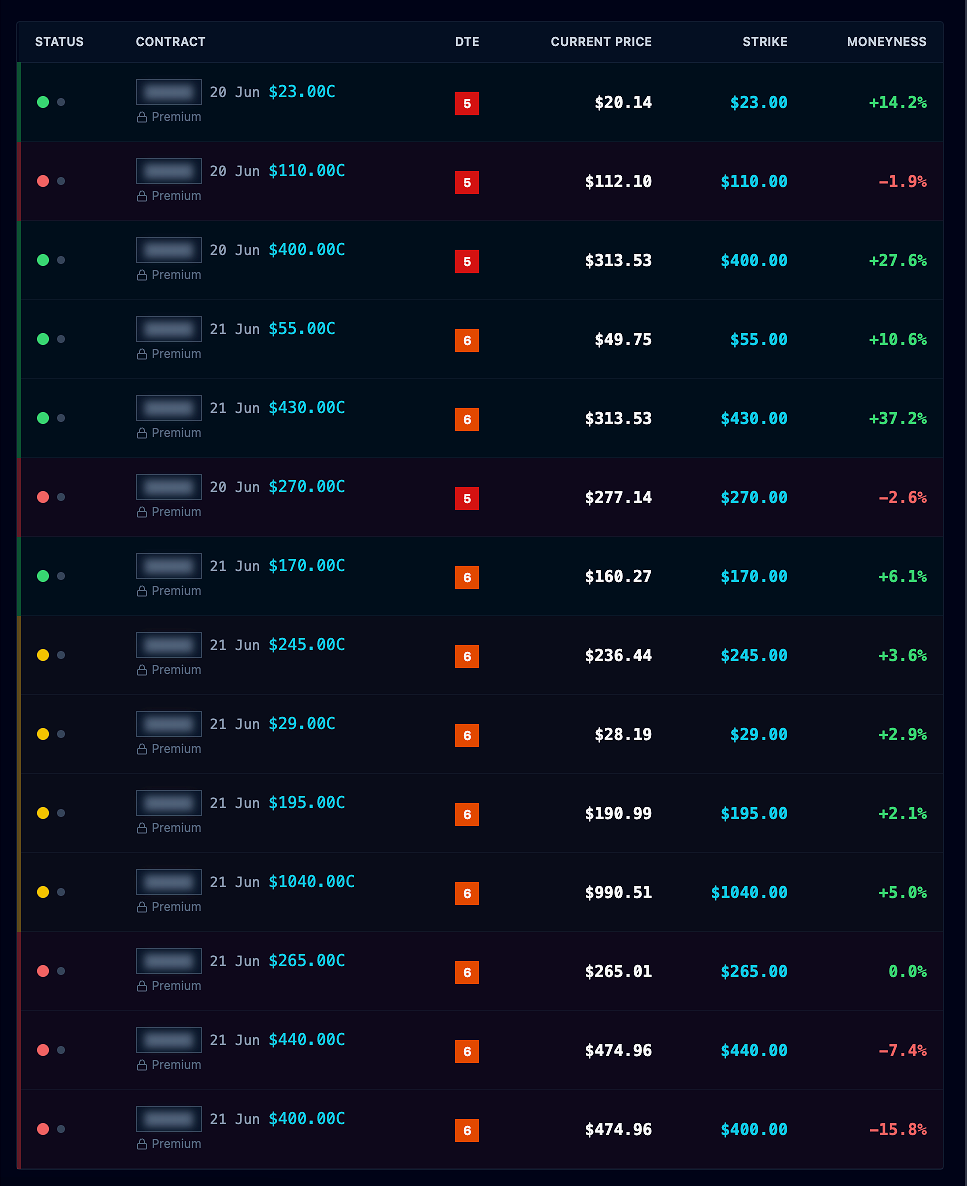
Now let’s see these rules in action by applying them to the current open positions:
Current Positions Snapshot:
IMPLEMENTATION PLAYBOOK & KEY ACTIONS FOR THE WEEK
Now let’s speak about the game plan for the week ahead.
IMHO, this is the most valuable part of our session, where we can see how analysis becomes action.
For each position, I've laid out the specific 'if-then' scenarios that help to guide the decision-making process. Study them. Each one is a real-time case study that shows you how to manage risk.
My goal is not just to show you what to do, but to teach you how to think and react like a professional.
LAST DAY: $299 Lifetime Membership ends at midnight.
Tomorrow it's $499.
July 1st, we stop offering lifetime memberships to new subscribers completely.
This is literally the final chance to lock in Lifetime Access at this price.
30-day money-back guarantee. Existing members are unaffected.
🔴 Red Zone Playbook: High-Priority Decisions + Possible Scenarios
Keep reading with a 7-day free trial
Subscribe to The Multiplier to keep reading this post and get 7 days of free access to the full post archives.