


10 Best Stocks for Covered Calls to Target 10x Returns

Let's start with a question that might sound familiar: "What are the top 10 stocks for covered calls?"If you've asked this, you're in good company.
It’s a natural starting point. But it’s also a question that can lead well-intentioned investors down a treacherous path.
It treats the market like a static catalog where a "best" list can be applied month after month, ignoring the dynamic, ever-changing reality.
This flawed approach naturally pushes investors toward the top of every "best for premium" list: names like Tesla and Nvidia. And the appeal is obvious—the premiums are intoxicating, these are the market's most volatile superstars.
Herein lies the fundamental conflict: the goal is almost always to generate this income without actually selling the high-flying shares.
And this reveals a fundamental conflict in the strategy.
So the logical question is how can one generate consistent income—let's say a smart and sustainable 1% to 1.5% a month—without constantly risking their core holdings?
Let me show you.
The High-Premium Illusion
The popular narrative, echoed from Reddit forums to "get rich quick" webinars, is to sell options on high Implied Volatility (IV) stocks.
The logic seems seductive: high IV means high premiums.
But high IV is not a free lunch. It is the market’s priced-in forecast of potential chaos.
It’s the compensation you receive for taking on the massive risk of a sudden, violent price swing.
When you sell a covered call on a high-IV stock—the kind that always populates "Top 10" lists—you are making a bet against a significant move.
Yet the very reason the premium is high is because the market, collectively, expects one.
If your primary goal is to preserve your capital and hold the underlying asset, this is a structurally disadvantaged position.
Peel back the curtain, and you’ll find a few critical risks:
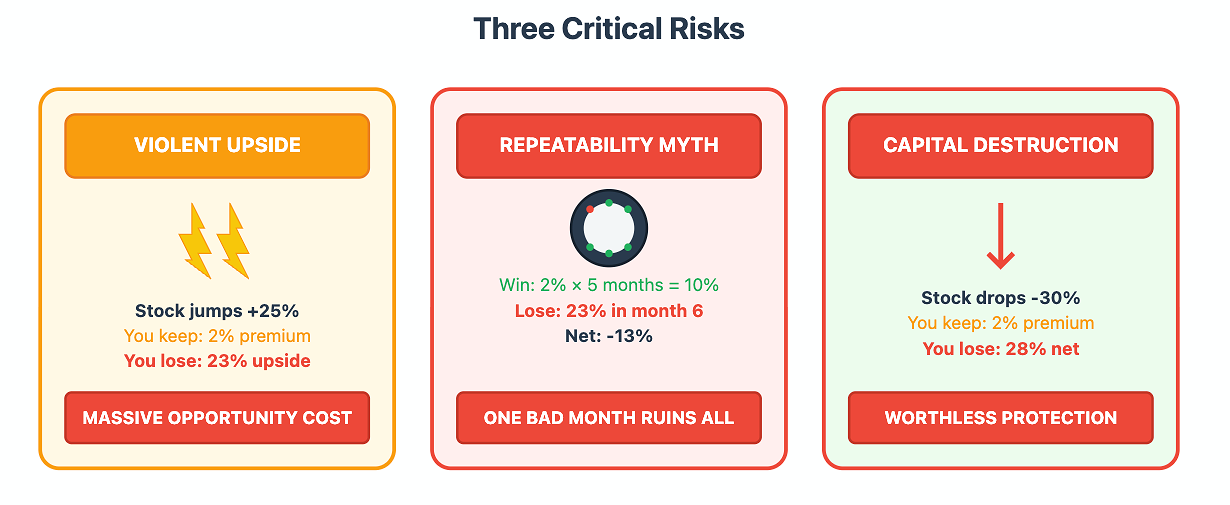
Violent Upside Risk (The "Fat Right Tail"):
The price movements of these exciting growth stocks don't follow a predictable pattern. Their defining feature is the potential for a "lightning strike"—a sudden, explosive rally that standard models don't fully predict. This hidden risk is exactly why the premiums are so high. The market knows there is a small but very real probability the stock could jump dramatically, and it prices the options accordingly. When you sell that call, you are taking the other side of that bet. You collect a 2% premium, but you surrender your chance at capturing the massive gain from a 25% lightning strike.
The Myth of Repeatability:
You might get away with it for months. But the one time you don't, the loss of your core position can negate all your previous "income."
A strategy is only viable if it is repeatable for years, not just quarters.
A list gives you a single idea; a machine gives you a repeatable process.
Chasing premiums on volatile assets is playing Russian Roulette — you can win five times in a row, but the sixth outcome negates all prior wins.
Capital Destruction on the Downside:
What happens when the unpredictable superstar stock plunges 30%? Your 2% premium offers laughable protection. You're now left holding a significantly depreciated asset, forced to sell calls far below your cost basis just to generate a trickle of income.

Are You Farming for Income or Gambling for Premium?
Think of your portfolio as a business.
Chasing high-premium calls from a "Top 10" list is like being a wildcatter drilling for oil. You might hit a gusher, but most of your bets will come up empty, and the whole operation is built on very high stakes.
An income investor, by contrast, operates like a farmer.
They aren't focused on hitting a single gusher. They focus on the system: the quality of the soil, the reliability of the irrigation, the predictability of the harvest.
When you write covered calls, you must adopt that same mindset.
Favor the predictable, "workhorse".
It’s the difference between building a methodical income-generating machine and blindly following a stock picker's list.

The ideal candidate for a covered call income factory is a stock that exists in the "volatility sweet spot": just enough fluctuation to generate meaningful premium, but not enough to give you a heart attack every morning.
These are often mature companies, sometimes dividend payers, that the market understands well.
A Quick Nuance: To be clear, this doesn't mean selling options on volatile stocks is always wrong. For traders focused on pure speculation or executing specific tactical plays, it can be a valid, albeit risky, strategy. But if your goal is to build a durable, long-term income machine, the risk/reward profile is fundamentally different. Our goal here is building a predictable monthly paycheck.
Case Study: Engineering Income with 'Project Gridlock'
This is where we stop hunting for picks and start building the machine.
A list gives you a what; a machine gives you a how and why.
It defines a process that filters the entire market for assets that fit our specific, conservative income goals.
So, let's see what kind of name our machine might identify.
We are looking for liquidity, moderate IV, and a history of trading within a predictable range.
A name like Intel (INTC) frequently fits this profile.
The market is punishing it for past missteps, yet it remains a massive company with huge cash flow and incredibly liquid options.
It's not likely to go bankrupt, nor is it likely to triple overnight. It tends to live in a range.
It is a perfect output of our income-focused machine.
Hypothetical Trade - Mid-June 2025: The 'Boring is Beautiful' Play
The Asset: Intel (INTC)
The Position: You buy 100 shares of INTC at a price of $20.20 per share (Total Cost: $2,020).
The Action: You immediately sell a call option with about 40 days to expiration. To balance premium with a reasonable buffer, you select a strike price that is nearly 10% out-of-the-money (OTM). Let's target the July 25, 2025, $22 strike call.
The Numbers: That call might offer a premium of approximately $0.80 per share, or $80 for the one contract.
Let's analyze the potential outcomes, including the bad ones:
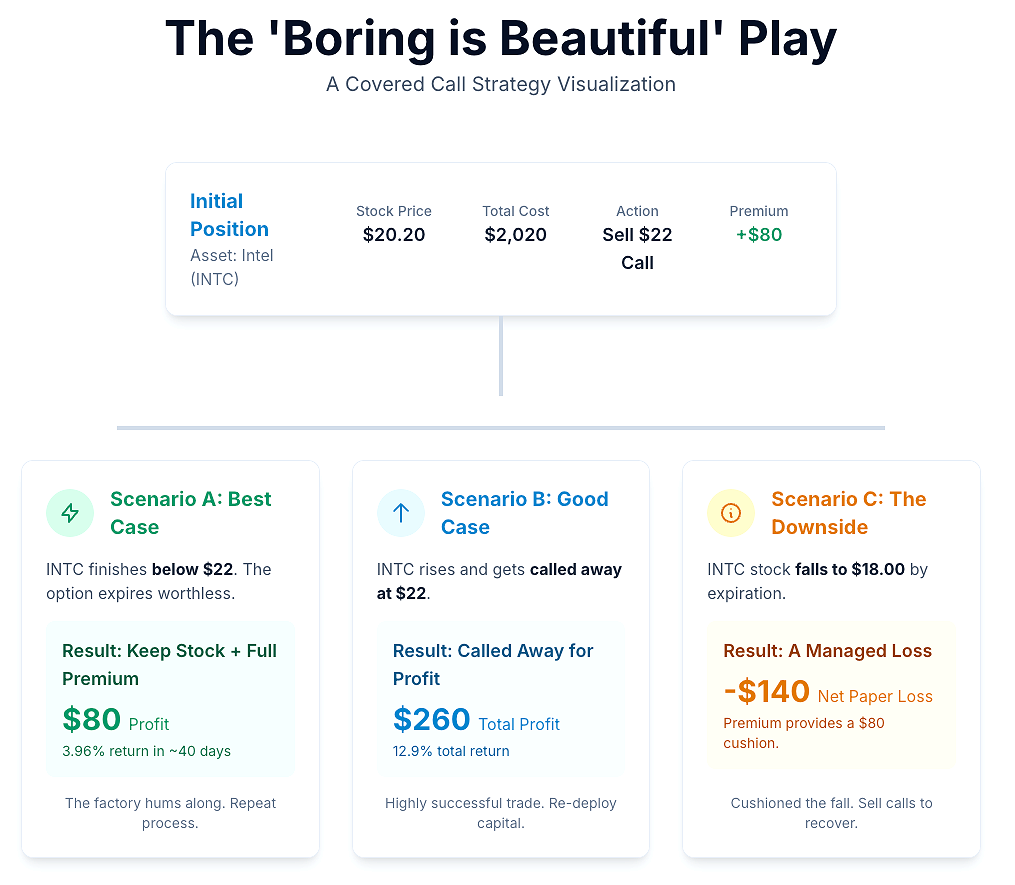
Scenario A (Best Case - Factory Hums Along):
INTC finishes below $22 at expiration. The option expires worthless. You keep the full $80 premium and your 100 shares.
Result: You've achieved a 3.96% cash-on-cash return ($80 / $2,020) in about 40 days. If repeated consistently, this annualizes to a return well over 20%, crushing your 1-1.5% monthly goal. You are now free to repeat the process. This is the factory at work.
Scenario B (Good Case - Called Away for Profit): INTC rises and gets called away at $22.
Result: You made $1.80 per share in capital gains ($180) plus the $80 premium. Your total profit is $260 on your $2,020 investment. That's a 12.9% total return. While you no longer have the stock, this was a highly successful trade. You can now re-evaluate and deploy that capital into another candidate identified by your system.
Scenario C (The Downside - A Managed Loss): The market turns, and INTC stock falls to $18.00 by expiration.
Result: The call option expires worthless, and you still keep the $80 premium. However, your shares are now worth only $1,800, an unrealized loss of $220 from your purchase price. The $80 premium acts as a cushion, making your net paper loss -$140 ($80 - $220).
Analysis: This is a loss, and it's important to acknowledge that. But compare it to the alternative. Without the covered call, your loss would be $220. You have cushioned the fall. More importantly, because your machine selected a fundamentally sound, non-speculative company, you can confidently continue to sell calls while you wait for it to recover. You are managing a drawdown, not facing a catastrophic wipeout.
**All prices and premiums are illustrative, based on market data from June 13-14, 2025, and do not account for slippage or commissions. Always verify live quotes before trading.
Your goal isn’t to find the perfect stock.
It is to build the perfect process.
Your weekend project is to construct the machine itself. Find a tool—a free one like Finviz, or the more advanced screeners built into brokerage platforms like Thinkorswim (TD Ameritrade) or Active Trader Pro (Fidelity)—and try filtering for these characteristics:
Stock Price: Over $20 (ensures institutional interest and avoids penny stocks).
Options Volume: High liquidity is non-negotiable. Look for average daily option volume in the thousands of contracts.
Implied Volatility (IV) Percentile: This is key. Look for stocks where the current IV Percentile is ideally between 30% and 70%. A value below 30% often means premiums are too suppressed to be worth the risk, while a value above 70% can signal extreme (and unpredictable) frenzy. This middle range is often the sweet spot for income generation.
The Chart Test: Pull up a one-year chart. Does it look like an electrocardiogram during a heart attack, or a series of gentle, rolling hills? You want the hills.
Fundamental Health: Your machine should also have a basic check for business quality (e.g., positive earnings, manageable debt). This ensures you're farming on fertile soil and protects you from company-specific disasters, not just market downturns.
Stocks in sectors like consumer staples (PEP, KO), mature tech (CSCO, a name like the INTC example), industrials (F), and telecoms (T, VZ) will frequently appear on this screener.
These are your workhorses, identified not by a headline, but by your system.
They aren't going to make you a hero on Twitter.
But they will do something far more valuable: methodically and predictably build your income, month after month.
However, the ultimate takeaway is not a list of stocks but a method of thinking. By building a system to filter the market, you move from a position of hope to a position of control. You are no longer chasing the market's whims; you are letting a disciplined process bring the right opportunities to you.
This is the core of sustainable income generation.
Trust in your process, stick to your rules, and focus on repeatable results.
The thrill of the chase is fleeting, but the confidence that comes from a well-built system is lasting.
Thank you for tuning in today and supporting this publication!
Mike Thornton, Ph.D.
Hi Mike,
Sorry for the noob questions but I'm looking at how to implement such a stock screener and I don't see some of these metrics in Finviz, like IV or options volume. Would I need a premium subscription to be able to use these metrics in a screener?
On the other hand I do have most of those metrics in my IBKR account but not sure if they all match. For IV I have options implied volatility % and I also have IV/Hist. Vol % (ratio of the IV over the historical volatility as a %). Which of these 2 would you use for screening?